Wireless, Real-Time Seat Interface Pressure Mapping With a Smartphone as Biofeedback For Positioning and Pressure Relief
Tamara L. Vos-Draper1, Aaron Rindflesch2, and Melissa M.B. Morrow3
1Department of Physical Medicine & Rehabilitation, 2Program in Physical Therapy, and 3Division of Orthopedic Research, Mayo Clinic, Rochester, MN
abstract
Pressure ulcers are life threatening and costly for wheelchair users with spinal cord injury(SCI). Seat interface pressure mapping can be used as one tool to reduce the risk of pressure ulcers. Such technology has been available mainly in the clinical setting. The goal of this project was to design and develop a prototype pressure mapping system for use at home in a wheelchair user’s daily routine. The system consists of a thin and flexible pressure mat that wirelessly transmits data to a web-based application on a smartphone. End-users are able to view their average pressure and Dispersion Index in real-time or send them to a Seating Clinic specialist. Preliminary testing was performed with 5 wheelchair users with SCI to test the skin safety of the mat in addition to the repeatability of the average pressure and Dispersion Index over a 3 hour testing period. There was no adverse reaction of the skin to the mat and the Dispersion Index showed good consistency across trials. Future studies will measure pressure relief maneuvers while using the mapping system as biofeedback, with the hypothesis that movement will increase and lead to improved prevention of pressure ulcers.
background
Pressure ulcers have a profound adverse effect on the quality of life for wheelchair users with spinal cord injuries and are costly to treat. At any given time, about 25% of 200,000 people with SCI will have a pressure ulcer related to sitting.(Krause, 1998; Raghavan, Raza, Ahmed, & Chamberlain, 2003) The estimated cost for treating pressure ulcers in people with spinal cord injuries is $6.3 billion annually.(Akins, Karg, & Brienza, 2011) Sepsis is a secondary complication that occurs in about 26% of non-healing ulcers and the mortality rate is as high as 50% when sepsis is present. (Staas & Cioschi 1991; Thomas, 2001) Early detection is a factor in preventing more serious complications. (Raghavan, et al. 2003) A 63% recurrence rate for pressure ulcers has been observed in at least one prospective study. (Bates-Jensen, Guihan, Garber, Chin, & Burns, 2009) A correlation between increased interface pressure and development of pressure ulcers has been identified. (Brienza, Karg, Geyer, Kelsey, & Trefler, 2001)
There are specific postural and anatomical characteristics that cause people with spinal cord injuries to be at higher risk for pressure ulcer development. Muscle atrophy, reduced or no movement, postural changes related to stability-seeking posterior pelvic tilt with forward curved thoracic spine all contribute to risk of pressure ulcer development.( Byrne & Salzberg, 1996; Drummond, Breed, & Narechania, 1985; Hobson & Tooms, 1992) One study showed that when >55% of overall pressure is distributed at sacral and ischial area, or when >30% of pressure is present under one ischium, or >11% of pressure under the sacrococcygeal area, a person with spinal cord injury is at increased risk for developing a pressure ulcer.(Verschueren, Post, de Groot, van der Woude, van Asbeck, & Rol, 2011) A smaller range of trunk movement results in smaller range of center of pressure distribution and is a contributing factor to development of pressure ulcers. (Karatas, Tosun, & Kanatl, 2008)
Prediction or prevention of pressure ulcers in people with spinal cord injuries is an ongoing challenge. In one study, subjects who identified the initial stages of an ulcer and took action had less severe pressure sores than those who waited longer to seek medical attention. (Garber, Rintala, Rossi, Hart, & Fuhrer, 1996) Another study showed that there is a direct correlation between magnitude and duration of interface pressure and subsequent development of a pressure ulcer.(Maklebust, 1987) There is not a gold standard for maximum threshold for pressure, unfortunately. (Reenalda, Jannink, Nederhand, Jzerman, 2009) Dispersion index of >55% on sacral/ischial areas has been correlated with increased incidence of development of pressure ulcer. (Sprigle, Dunlop, & Press, 2003)
Pressure sensors and the field of pressure mapping have been present in the clinical setting for the past 20 years. Technology continues to advance, allowing increasing usefulness of pressure mapping data. There is an interaction between use of a mat between the subject and their pressure relieving cushion, as studied by Pipkin in 2008, and that needs to be considered as a potential limitation of using a home-based system. (Pipkin & Sprigle 2008) Finally, bench tests have revealed concerns regarding drift or creep, hysteresis, repeatability, and response time of the sensor mats, but these studies were completed over one decade ago and sensor technology has changed considerably. (Nicholson, 2001)
purpose
The purpose of this project was to design and construct a prototype at-home seating pressure mapping system that would allow the user real-time feedback of their seating pressures using a pressure mat and smartphone for data capture and display. Additionally, the pressure mat was tested for skin safety and preliminary outcome variables were investigated for repeatability.
METHODS
Design objectives
Design objectives were developed in a team consisting of clinicians, engineers, designers, and feed-back was sought during a focus group discussion with 5 intended end-users of the design. The end-users identified the following as most critical to the design: durability, ability to sit on the mat all day, portability, rechargeable battery, and affordability. Four of the 5 users had smart phones and identified desire to watch their map in real-time on their phones as needed during the day. The users shared intent to use the map on a variety of surfaces including shower or commode, car seat, arm cycle, and other seating surfaces. Additionally, users want the ability to scan throughout the day for problems, save recordings over time, forward a recorded session to their seating clinic therapist for review, and use the map to assist their caregivers in positioning them correctly in their chairs.
The design team decided on the final requirements for the project: affordable; durable and waterproof; safe for user to sit on all day; portable; and wireless transmission of data from mat; web-based application to view data on smartphone.
Methodology/Design
Pressure mat
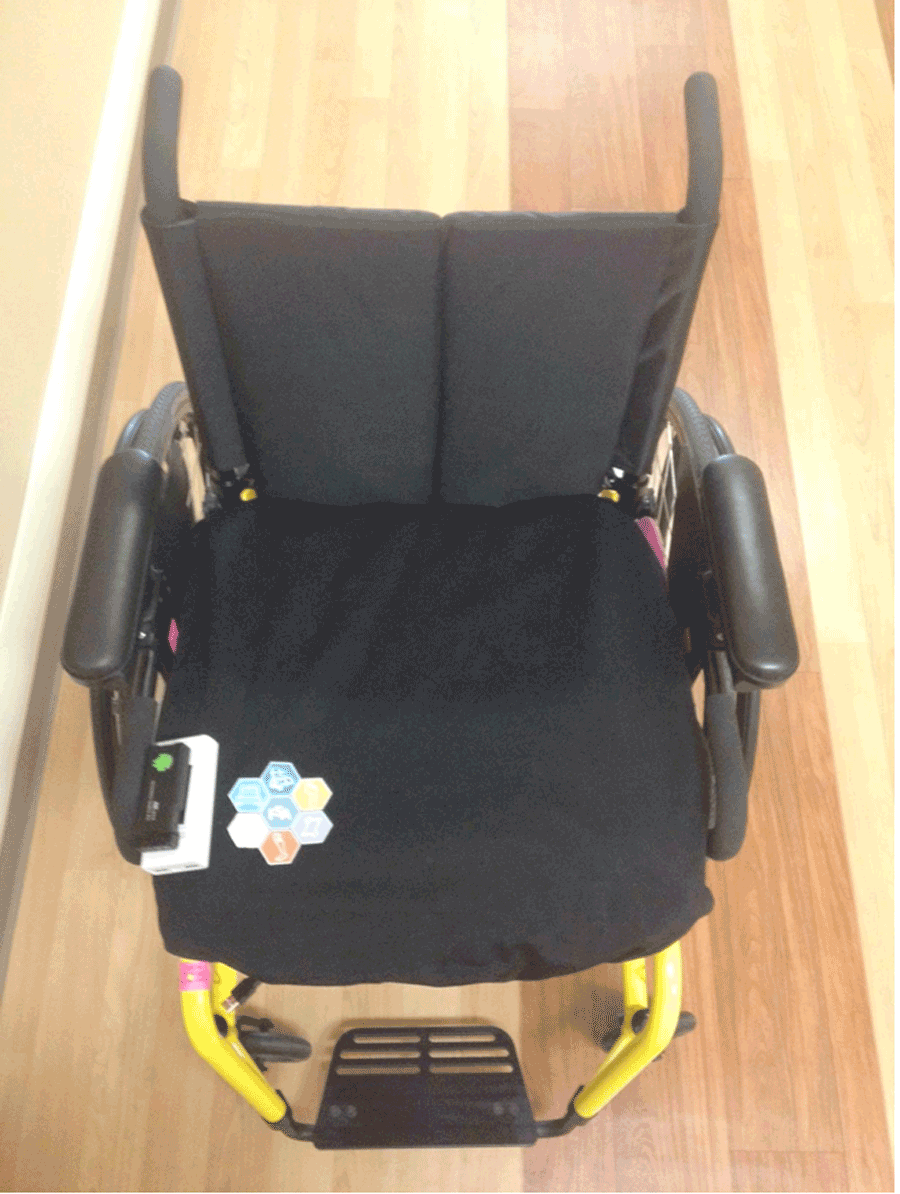 Figure 1: Wireless pressure mat shown placed over a seat cushion with portable power and mini-PC shown
For the purposes of choosing a commercially available pressure mat that met our design objectives, multiple pressure mats were purchased and laboratory testing was performed to determine whether their performance was satisfactory for the project needs. First, objects of known dimensions and weight were tested on each pressure mat over long periods of time and over consecutive days to investigate the drift characteristics of the data. Additionally, preliminary accuracy testing was performed comparing the pressure mat output against floor embedded forceplates (AMTI,Watertown, MA).
The final pressure mat chosen for the project prototype was the patented 4-way stretch, sensing, and wireless mat developed by Vista Medical, Inc (Fig. 1). A formal partnership was created between Mayo Clinic and Vista Medical, Inc. for further development of the wireless, at-home system. The sensing mat is 3 mm thick, stretchable, moisture resistant, and the outer layer is a 1mm thick, 4-way stretch, water resistant material.
Preliminary safety and repeatability testing of the pressure mat
To determine the safety of the mat against the skin and the preliminary repeatability of potential outcome variables, a pilot study with 5 subjects was conducted. The study was approved by the Mayo Clinic IRB and all participants gave written consent. To be included in the study, subjects were required to be wheelchair users with SCI, have had a pressure ulcer in the past, and between the ages of 18 and80. People were excluded from the study if they had any current pressure ulcers.
The study design included 3 separate sessions for each subject wherein each person sat on the mat atop their own cushion in street clothing for 3 consecutive hours. The subjects were asked to wear the same lower body clothing to each of the 3 sessions. The subjects were instructed to relieve pressure for 2 full minutes every 30 minutes during testing. Pressure relief maneuvers included power tilt or leaning forward or to side. Their skin was examined prior to sitting on the mat and again after 3 hours. Additionally, the average pressure and average dispersion index of pressures was determined over 6 minutes at the beginning and end of each 30 minute trial within each session. The average pressure was determined by taking the mean of all the pressure readings over the entire mat during the 6 minutes. The dispersion index of pressure was determined by taking the sum of all pressures on the back half of the mat (area under the ischial tuberosities and coccyx) and dividing by the sum of all pressures over the entire mat (Maurer & Sprigle, 2004; Sprigle, et.al, 2003). For preliminary analysis of this pilot data, the trends in repeatability were qualitatively assessed.
Web-based application prototype development
The goal of the web-based application was to allow the end-user to view their pressure maps in real-time on their smartphones or computer within a user-friendly environment. For the prototype, the application was designed to capture data from the pressure mat for 15 seconds at a sampling rate of 5 frames per second when activated by the users. The user would be able to view their play back the recording; and view the full pressure map image, average pressure, contact area and Dispersion Index in real time in view-only mode. Future developments under way include adding a clinician tools area for individualization of readings.
results and discussion
Preliminary safety and repeatability testing of the pressure mat
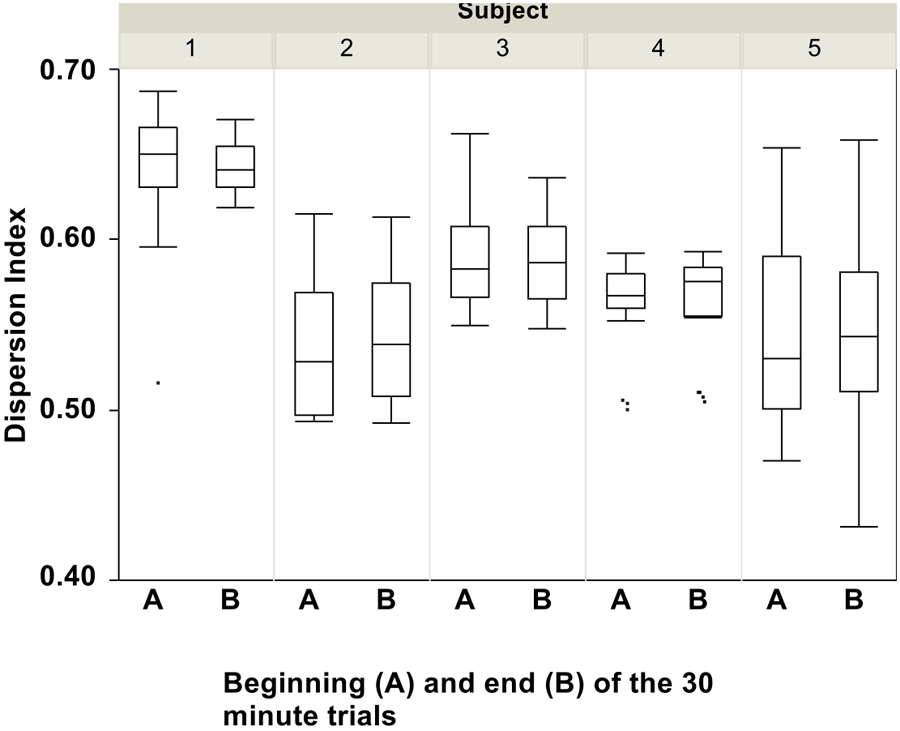 Figure 2: Dispersion Index at the beginning (A) and end (B) of the 30 minute trials for each subject. Data are from the average over all three days.
Of the five participating subjects (avg. age 47.2 years, avg. weight 78.2 kg), 3 were manual wheelchair users and 2 were power wheelchair users. Fourteen sessions were available for analysis because third session from subject 2 was inadvertently deleted. There were no changes in skin color or integrity observed in any of the 5 subjects for any of the 15 sessions.
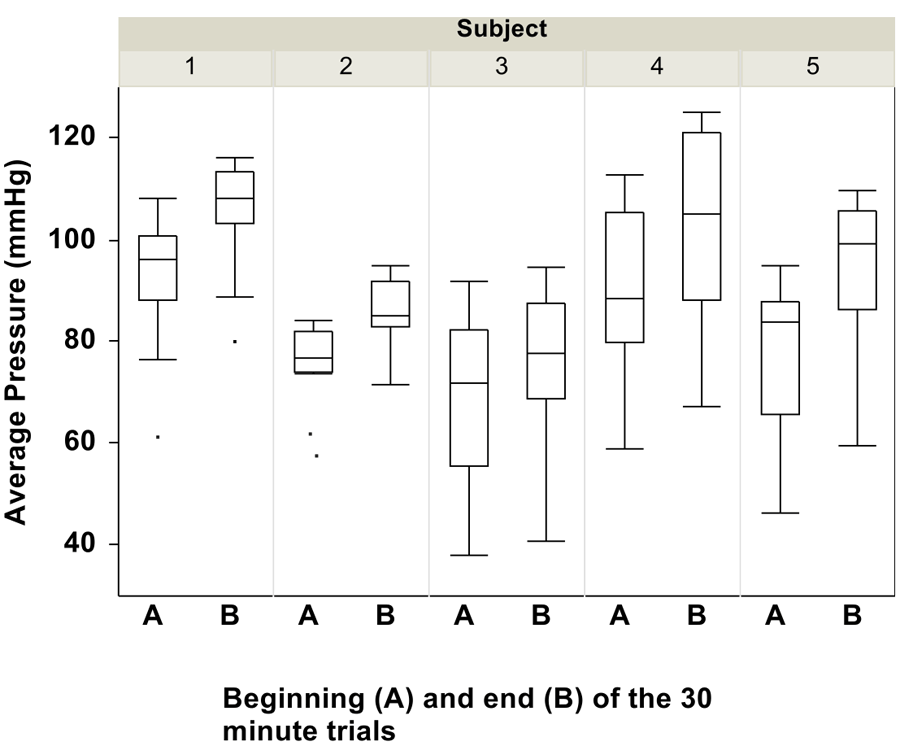 Figure 3: Average pressure at the beginning (A) and end (B) of the 30 minute trials for each subject. Data are from the average over all three days.
The preliminary repeatability data showed that the Dispersion Index was less affected by the drift and hysteresis than the average pressure. Smaller relative differences were observed within each subject in the Dispersion Index (Fig. 2) between the beginning (A) and end (B) of each 30 minute trial than in the average pressures (Fig. 3). Additionally, over the 3 hour period, the average pressure tended to increase over time whereas the Dispersion Index remained more constant. Our results concur with observations from the literature regarding the issues of drift and hysteresis of pressure mat readings.
Web-based application
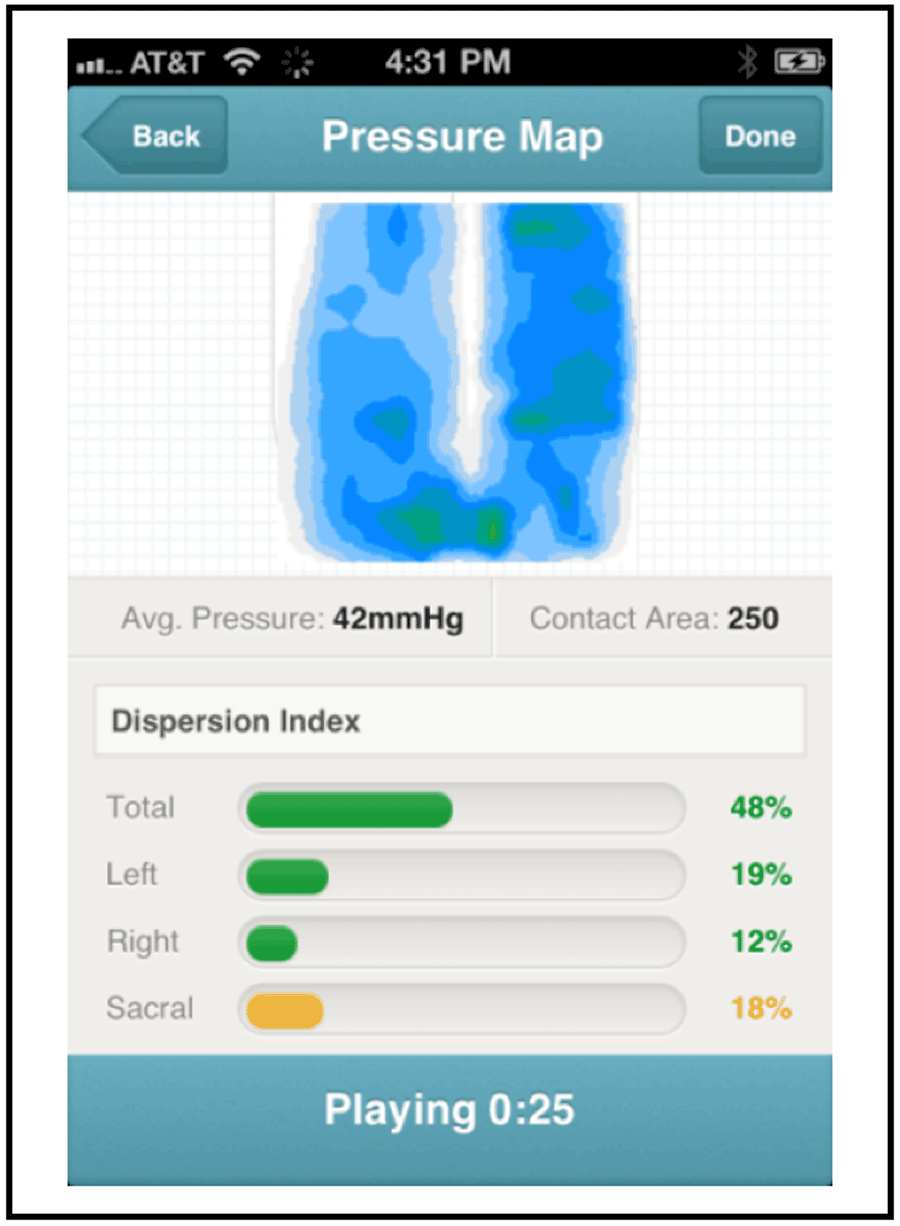 Figure 4: Pressure mapping web application as viewed from an iPhone
The web-based application prototype was developed and successfully received and displayed data from the wireless pressure mat on a personal smartphone (Fig. 4). The prototype app did not allow the clinician to select individual dispersion index areas of the map, so generic sections were used. Future versions of the software will allow for more individualized settings.
conclusion
A prototype has been successfully developed that allows wheelchair users with SCI to self-monitor their seat interface pressure outside of the clinic environment. Further testing will determine if the use of this device as a biofeedback mechanism successfully changes user behavior by increasing trunk movement resulting in increased pressure relief maneuvers throughout the day.
References
Acknowledgements
The Center for Innovation at Mayo Clinic provided funding for development of this project through their CoDE Award. http://www.mayo.edu/center-for-innovation/ Team: Brant Gourley, Project Manager; Molly McMahon, Designer; Nadia Wood, Programmer all from Center for Innovation and Jeffrey Strommen, MD; Megan Gill, PT; Lisa Beck, RN, CNS; Department of Physical Medicine and Rehabilitation and Meegan Van Stratten, PT and Kristin Zhao from the Division of Orthopedic Research at Mayo Clinic.
Andrew Frank, Vista Medical Ltd, Winnipeg, Manitoba. http://www.pressuremapping.com/